ADDRESSING SAFETY TO INCREASE RIDERSHIP
for Chicago Transit Authority (mock project)
PROJECT OVERVIEW
The Chicago Transit Authority (CTA) is the second biggest public transportation system in the United States. In a city of 2.7 million people, about 1.6 million riders rely on its service on an average weekday. The CTA experiences a range of issues—delays, interruptions, and closures that cause a negative impact for riders. Over the years, there has been a decline in ridership and an increase in car traffic in the city of Chicago. For this mock project, my team was tasked to create a digital solution to increase ridership and confidence in the CTA rider community. Our final product had to leverage Google Maps’ API, a mapping platform that provides data of track location, distance, direction, and current traffic conditions
MY ROLE
I worked within a team of three UX designers in four-week sprints: (1) User Research, (2) Concept Development and Testing (3) Reiteration, Testing, and Final Deliverable. Although the responsibilities were shared throughout the process, each designer created conducted interviews, created wireframes, and led user testing.
This was a mock project to help the UX designers utilize the UCD design process. Outside the mock project, I took the initiative to create the UI for our final design to showcase my visual design abilities.
This was a mock project to help the UX designers utilize the UCD design process. Outside the mock project, I took the initiative to create the UI for our final design to showcase my visual design abilities.
CHALLENGE
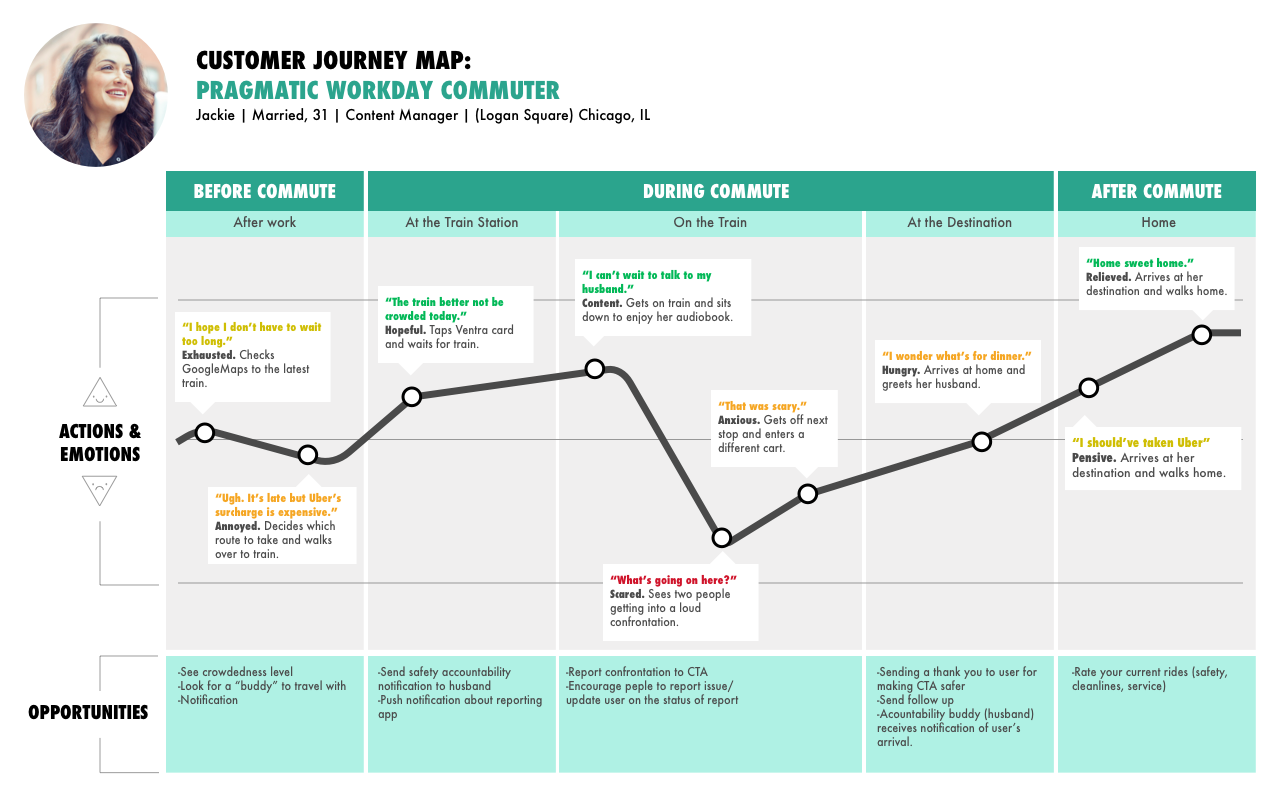
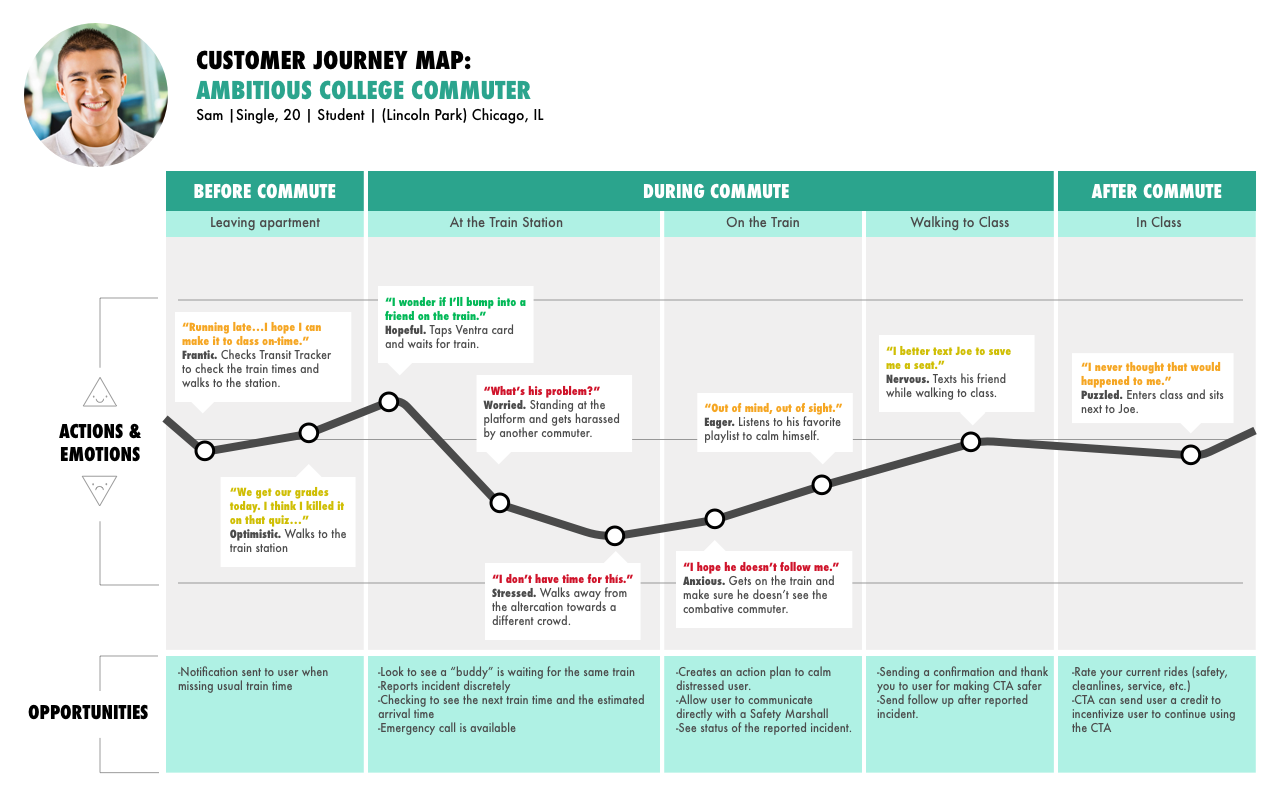
CTA riders need to feel more in control of their safety during their commute, so they could utilize the CTA regardless of the time or environment.
Our research validated that there was a decline in overall ridership. However, we learned that rail ridership stayed pretty stagnant over the years, and delays didn’t attribute to the decline significantly. The problem we saw was that there was a decrease in rides per rider.
As we look further into this decrease, our research presented that safety affected rider’s commuting experience. Nearly all riders had experience risky situations on the CTA. Past experiences led riders to opt for rideshare or to choose not to travel during times when they feel unsafe. Some riders felt powerless when witnessing disruptive behaviors on the CTA.
As we look further into this decrease, our research presented that safety affected rider’s commuting experience. Nearly all riders had experience risky situations on the CTA. Past experiences led riders to opt for rideshare or to choose not to travel during times when they feel unsafe. Some riders felt powerless when witnessing disruptive behaviors on the CTA.
SOLUTION
As a result of research and numerous rounds of iteration, my team converged to our final solution that focus on addressing safety with a transit app.
Chi Line helps riders avoid undesirable situations during their commute by creating alternative routes with other riders’ submitted safety reports. Keep the CTA safe for everyone.
.gif)

Sam sends a safety report during his commute.
Sam is using the Red Line to run errands. During his commute he notices that there’s an intoxicated rider causing commotion. Sam decides to report this rider.
Sam sends a safety report during his commute.
Sam is using the Red Line to run errands. During his commute he notices that there’s an intoxicated rider causing commotion. Sam decides to report this rider.

Jackie takes safer route to her destination.
Jackie is meeting some friends at restaurant after work. She was planning on taking the fastest route but decides to take an alternative route instead due to a safety alert.
.gif)
UI DESIGN WORK
As a result of research and numerous rounds of iteration, my team converged to our final solution that focus on addressing safety with a transit app:
Still interested?
Scroll down to see the extended version of the case study
Extended version is available for desktop and tablet viewing.